Through the Lense #3 — Five Mid-season Data Trends Through Spring 2026
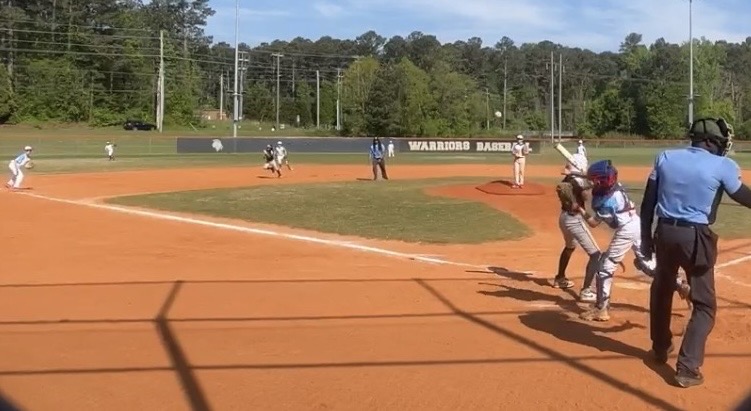
We're halfway through Spring 2026. 15 active teams. 12 uploading every weekend. 5,330 plate appearances. 969 innings pitched.
We sat down to write a "here's how the season's going" post and ended up rewriting it three times because the numbers kept surprising us. Here are five that won't leave our heads — plus one thing the data is not saying yet, which we think matters just as much.
1. Stolen-base success rate at 10U/11U: 92.7%
This was the one we had to triple-check.
Across 1,208 stolen-base attempts on the platform this spring, 92.7% have been successful. For context:
Caught-stealing has been functionally eliminated as a defensive outcome at this age. It's not a deterrent. It's a tax that gets paid maybe once a tournament.
Where we keep landing: a team that develops a catcher with real throwdown fundamentals — clean exchange, quick footwork, consistent release — is sitting on a structural advantage no one else has. Every CS taken off opponents is rewriting run-expectancy math nobody else is fighting for.The highest-ROI summer project we can think of for most teams is one catcher fundamentals drill plus one pitcher timing drill (slide step, varied holds, periodic pickoffs even when no one's going). Runners at this level get comfortable when every delivery looks identical. Make them uncomfortable and the math may show a completely different story.
If you've got a youth-specific pop-time benchmark from a coaching authority you trust, drop it on us. We want to get this one as right as possible.
2. The 10U → 11U jump is huge — but pitchers may not deserve as much credit as you may think.
| Age | Median ERA | Median WHIP | Median K/BB | Strike% |
|---|---|---|---|---|
| 10U | 7.43 | 2.06 | 1.40 | 57.2% |
| 11U | 4.91 | 2.33 | 1.00 | 54.7% |
ERA falls 34%. But strike% goes down. K/BB goes down. WHIP goes up.
We read this three different ways before accepting it: pitchers at 11U aren't throwing more strikes. The infield behind them is converting more routine plays.
If you're at 10U right now and your pitchers feel like they're getting hammered — they're probably not. They're probably throwing fine, and the gloves haven't caught up to them yet. That's a coachable, fixable thing, and it's the highest-ROI infield work you can do this summer.
3. The median platform hitter walks more than they strike out
73 qualified hitters (≥30 PA). Median K% = 11.8%. Median BB% = 11.9%. More than half the platform's qualified hitters have a true BB > K profile.
We genuinely didn't expect this. On the FanGraphs reference scale, 20% K is "average" for an MLB hitter and 12.5% K would qualify as "great." Our platform median is sitting at 11.8%. We've all watched enough big-league at-bats to think strikeouts should outnumber walks at every level. They don't here.
The lesson we keep coming back to: "be more patient" stopped being useful coaching advice somewhere around 9U. Patience is the platform median. The differentiator is what a hitter is patient for — first-pitch fastballs in the zone, late-count breaking balls. That's a whole different conversation than "take more pitches."4. Batting averages are running hot — and we think it's a trap
Platform median BABIP: .394.
For comparison, MLB's 2024 league BABIP was .295 in the NL and .286 in the AL. About a quarter of the platform's hits are landing because youth defense isn't catching up to them yet, not because contact quality demands it.
We think this may matter more than people realize. A 10U hitter batting .380 on a .500 BABIP is going to lose 100 points of average the moment he ages up to 12U — because the gloves get there.
If you want to know which of your hitters' numbers will survive the next age-up, the stat we'd watch is LND% (line-drive rate — the percentage of at-bats producing hard line-drive contact). High LND% means the kid is hitting the ball hard regardless of where it ends up. That's the leading indicator AVG was never built to be.
5. Mid-season explosions are real — and they're enormous
Eight hitters added between +0.250 and +0.626 of OPS between their first-half and second-half snapshots. Minimum 15 PA on each side, so this isn't noise.
The biggest mover: an 11U player who jumped from a sub-replacement first half to a +.626 OPS second half on a +.258 batting-average bump.
The thing we want every parent reading this to hear: stats aren't permanent at this age. Development is. The kid who looked lost in March is, more often than not, the kid who's locking in right now.
What we don't see in the data yet (and why it matters)
We want to flag this because it might be the most important thing in the post.
There is no clutch-hitting signal in the data. Two-strike performance, RISP, two-out RBIs — every "clutch" measurement at half-season sample size is too noisy to trust. The variance at ~50 PA per qualified hitter swamps any real underlying signal.If anyone is selling you a "clutch grade" or a "pressure score" for a 10U/11U player based on half a season of data, ignore them. The math isn't there yet. Maybe by full season we'll have something — we'll let you know either way.
Where we land on all this
We built this platform partly because we wanted the data to tell us something we didn't already believe. Halfway through this season, it's done that more than once.
Stats aren't permanent at this age. Development is.What's the one stat your team has been built around this year, and why? We genuinely want to hear.
---
Sample: 5,330 plate appearances and 969 innings pitched across 15 active-subscription GameLense teams, 12 of which have uploaded at least one snapshot in their Spring 2026 season. Predominantly 10U and 11U travel baseball — interpret all "platform" findings through that lens. Methodology: Stats aggregated using GameLense's canonical aggregator (the same engine that powers the dashboards). Archived snapshots and baselines excluded. Qualified-hitter threshold ≥30 PA. Qualified-pitcher threshold ≥10 IP. "Movers" require both first-half and second-half samples of ≥15 PA. Sources:See these stats in action
GameLense calculates these stats automatically from your team's GameChanger data.
Start your free trial